Teams are losing time to scattered docs, duplicate work, and AI tools pulling from stale information. This guide on How to Leverage Business Intelligence for Knowledge Management focuses on the practical systems, choices, and habits that make knowledge more usable. Today’s challenge is turning knowledge into something people can actually find and use across fast-moving teams.
But wait, there’s hope on the horizon. Enter business intelligence and knowledge management integration, stage left. It’s like a superhero duo for your data woes. At LEAD.bot, we’ve witnessed first-hand the transformation — companies turning their scattered (often neglected) data into strategic superpowers… assets that fuel smarter decision-making and spark innovation across teams.
This guide? It’s your roadmap — on how to wield BI tools to capture knowledge effectively, share it widely, and measure its impact. Simple as that.
What Transforms Raw Data Into Strategic Knowledge
Let’s talk business intelligence. It’s a game changer, folks. It’s like you’re taking a disorganized attic full of dusty boxes and turning it into a freaking Apple Store. Traditional data? Just sits there. But BI systems? They dive in-turning raw data into something that can actually steer the ship. We’re talking decisions made at lightning speed. Why? Because analytics users told us the decision clock is ticking faster than ever. These tools? They piece together the puzzle so teams can get moving, pronto.
From Data Points to Decision Drivers
It all kicks off when BI systems get their gears turning-grabbing data from everywhere. Every customer chat, every sale, every little metric from ops and even employee gripes go into this magic blender. Out come insights that make sense-like why things happen and what’s coming up. Microsoft Power BI, Tableau… they’ve got the visuals down. Even your grandma could see what’s up. Numbers? Those are just the opening act.
Analytics as Knowledge Discovery Engine
Now, about that engine-data analytics is the powerhouse. It’s got matching logic that Sherlock Holmes would kill for. Predictive analytics, wow! Tools like IBM Cognos? They’re not fooling around when it comes to finding what’s gonna be big for which team. And ThoughtSpot? Yeah, just start chatting with your data like it’s a buddy, and it’ll spill the beans.
Breaking Information Barriers Through Integration
The magic word: integration. Say goodbye to info silos. Unified dashboards bring together sales, customer service, product metrics-you name it. It’s like giving your organization x-ray vision. When departments stop flying solo and start syncing up, the results? Sweet. Companies going the BI route see cross-departmental collaboration that cranks up the impact because it’s all about shared insights, people.
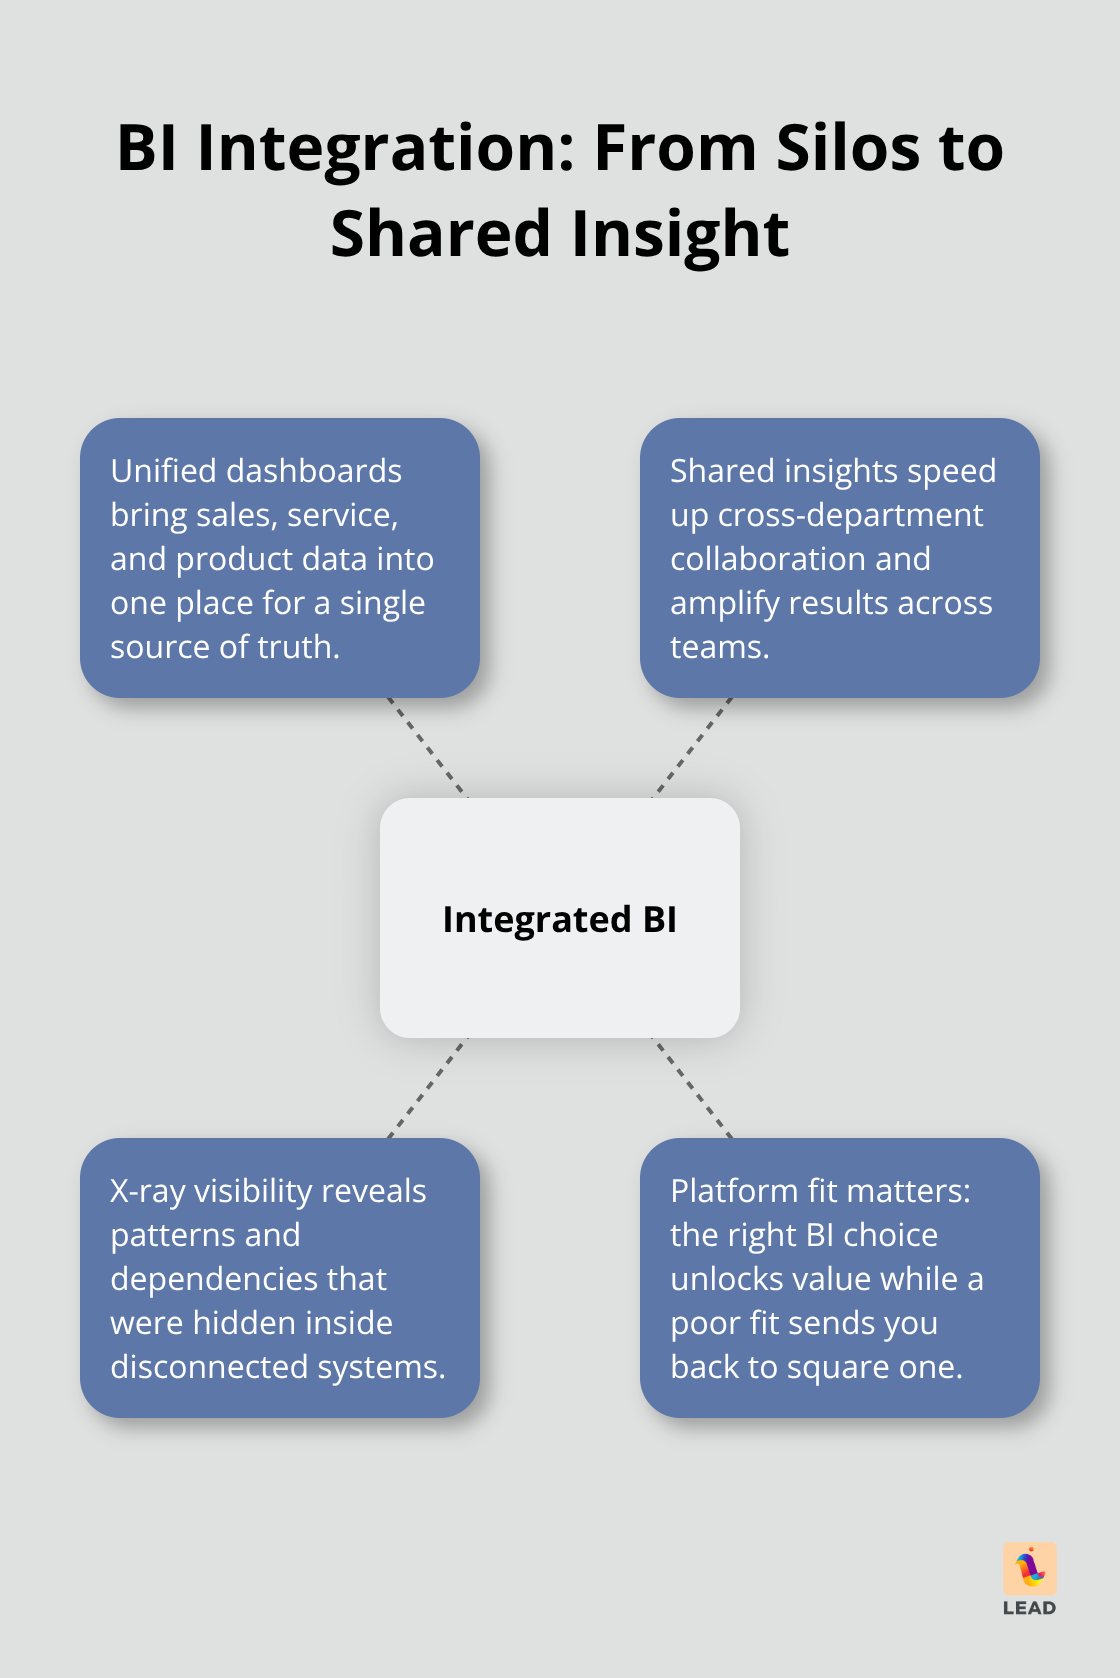
The blueprint’s set for strategic knowledge to morph into something awesome. But don’t forget-nailing it hinges on picking the BI platform that’s just right for your organization’s specific needs. Get it wrong, and it’s back to square one, folks.
Which BI Tools Actually Work for Knowledge Management
The platform you pick? It’s the lifeblood or the death knell of your entire knowledge management strategy. Power BI is the king in the enterprise realm-why? It seamlessly (almost creepily) syncs with the Microsoft ecosystems we all inhabit. But if your data’s looking like a Jackson Pollock painting, Tableau’s often the go-to for advanced analytics. Then you’ve got Qlik Sense, which crushes it in associative data modeling, and ThoughtSpot, democratizing data with natural language queries like it’s running for office. But here’s the pivotal stat: user adoption rates. High adoption? That’s where the ROI magic happens. Low engagement? Well, there go your BI dreams.
Data Pipeline Architecture That Scales
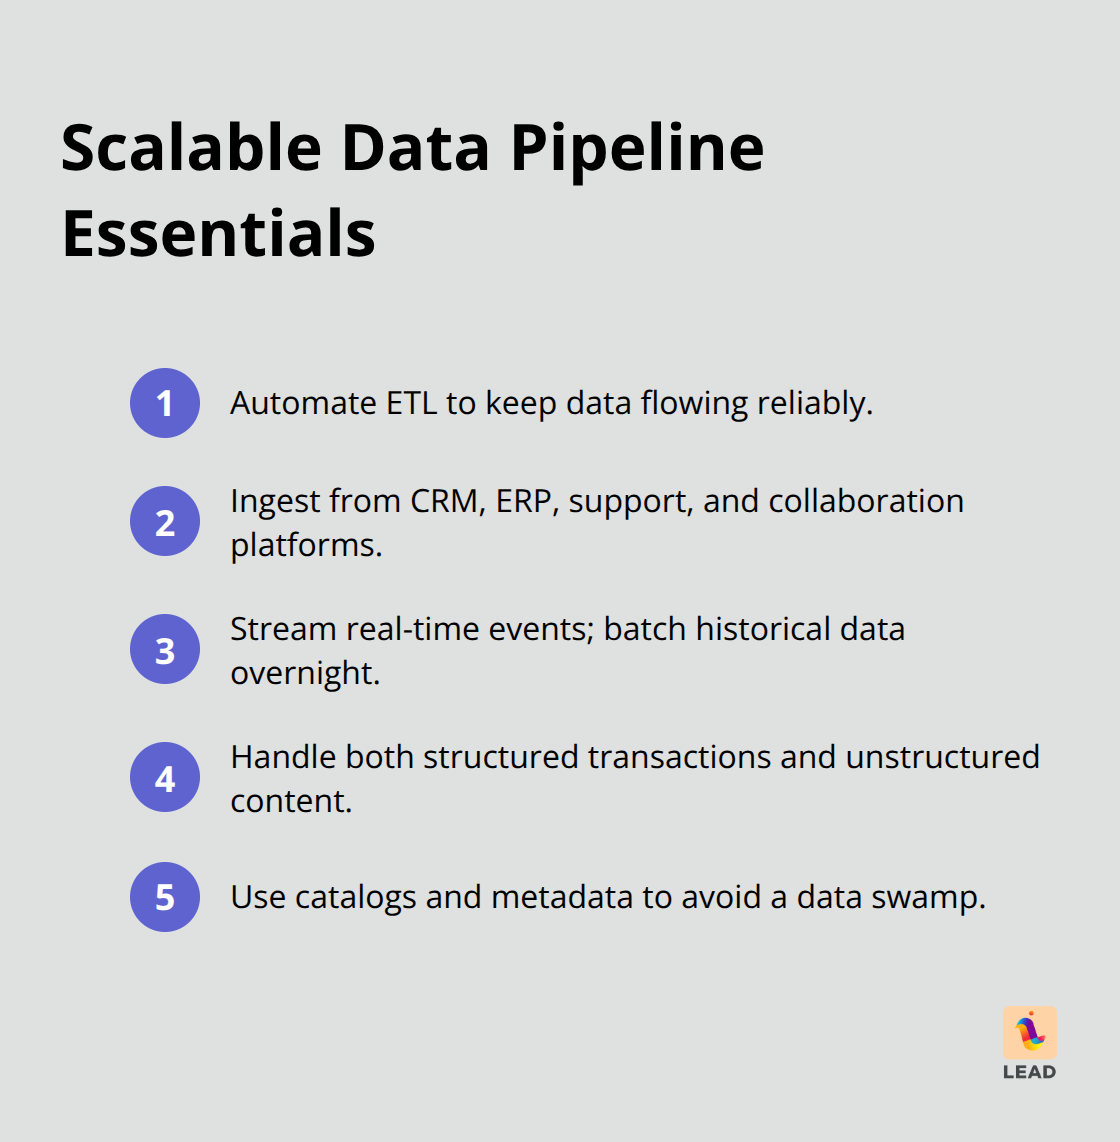
Your data pipes-are they flowing or clogging up like an old sink? Kick things off with automated ETL processes. Pull from all critical systems, like CRM, ERP, support tickets, and yes, even those collaboration platforms you probably ignore. Companies sprinting ahead with cloud-native solutions like Amazon Redshift leave the traditional data warehouse dwellers in the dust-thanks to snazzy internal networking components. Get those real-time streams rolling for customer convos and operational metrics, but do your historical data batch processing overnight (because who needs sleep, right?). This architecture’s gotta juggle both structured transaction data and the wild west of unstructured content from emails, documents, and chat logs. Modern data lakes? Sure, they gobble up everything, but without a solid catalog and metadata, you’re paddling in a data swamp.
Dashboard Design for Knowledge Discovery
Dashboards should shout insights, not just flash a bunch of charts like it’s Times Square. You need role-specific views-sales teams want the juicy customer intel, while product teams are all about feature usage analytics and user feedback patterns. Interactive filters? They’re the secret sauce that lets users dive from birds-eye trends into the nitty-gritty. Heat maps become treasure maps, showing you collaboration patterns and knowledge gaps (very handy for spotting expertise networks) while trend analysis points to which insights are actually moving the business needle. Top-tier dashboards have search functionality linking data with contextual research and documentation… voilà, a unified knowledge ecosystem that saves you from endless info scavenger hunts.
Integration Points That Matter
Got smart BI platforms? They’re the ones shaking hands with existing knowledge repositories and collaboration tools. Power BI is besties with SharePoint and Teams. Tableau? It clicks with Slack and other chatty platforms. These connections are essential-they capture knowledge as it flows through your daily grind. When your BI system sucks data from project management tools, support systems, and communication channels, you’ve got yourself a complete knowledge movement picture inside the organization. The crème de la crème setups auto-tag and categorize insights by department, project, or expertise area (making future searches way less like finding Waldo).
Success? It’s all about how your platform juggles technical chops and the human factors key to knowledge adoption. Next on the docket: measuring if your BI-powered knowledge management actually does the business or is just a wallet-drain fancy persona.
How Do You Actually Measure Knowledge Management Success
Forget the glittering dashboards or those shiny data visualizations. What’s the real deal with your BI-powered knowledge management? It’s all about the numbers. Do people actually share knowledge? Make smarter decisions? That’s the litmus test. Track the right metrics, and zoom-faster decision-making comes your way. But if you’re flying blind, you’re just burning cash on unused knowledge initiatives.
Knowledge Flow and Usage Analytics
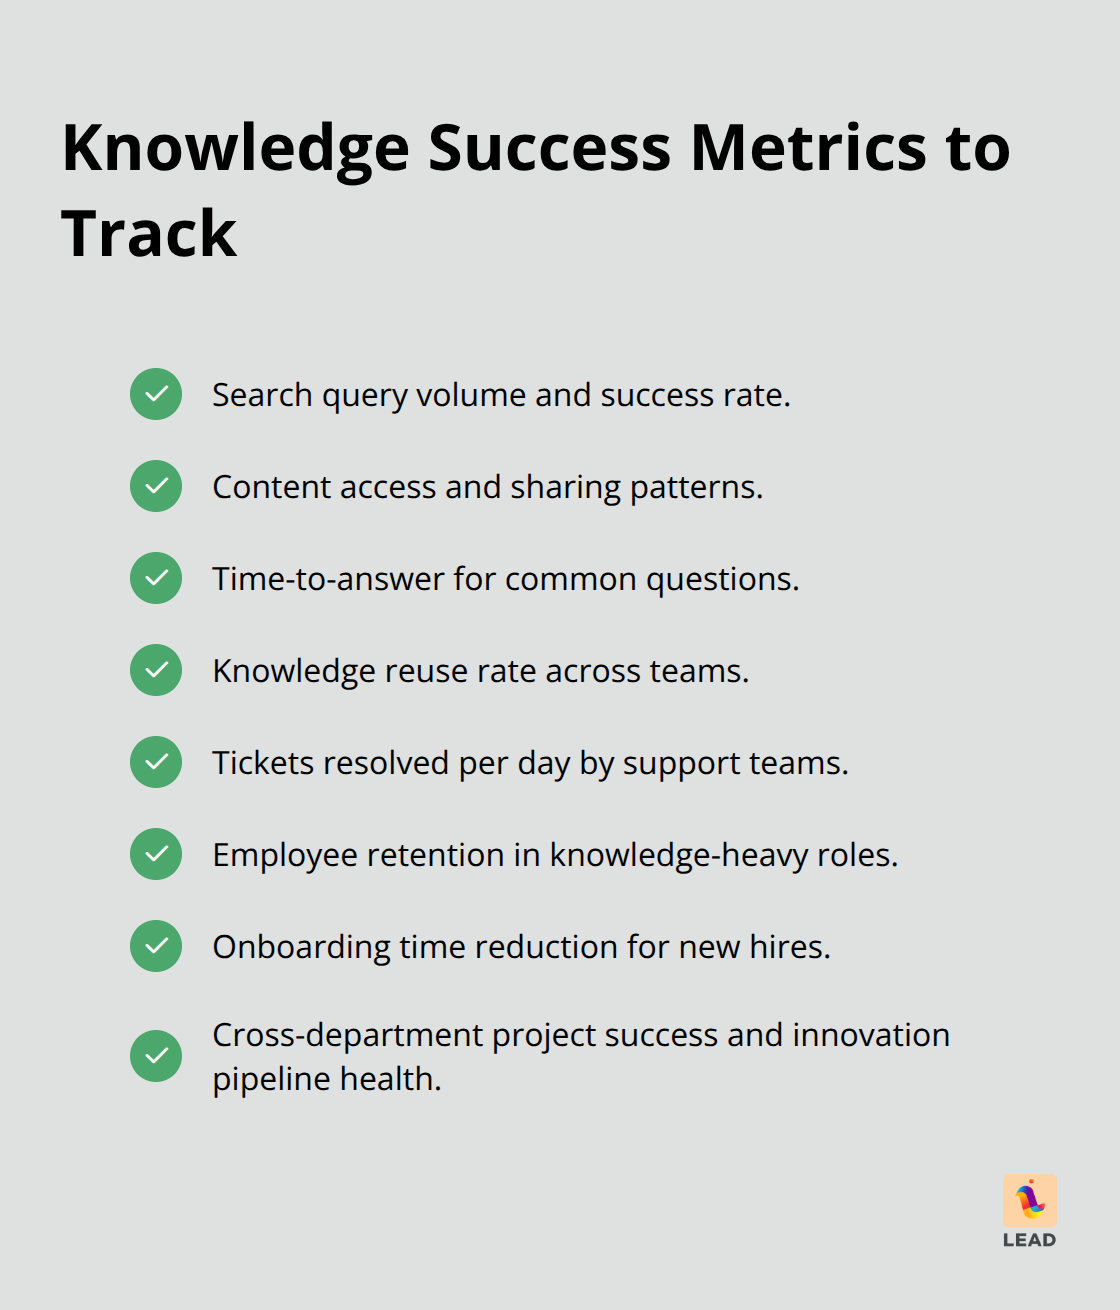
Dive into search analytics from your knowledge systems. Look at query volumes, search success rates, and content access patterns. High-performing teams? They’re all over those shared knowledge bases. The strugglers? Not so much. Keep an eye on which departments are content machines vs. which are the voracious consumers. Sales teams are usually on the consuming end of things, while product teams churn out all those juicy insights.
And time-to-answer… critical. If folks are lost in a maze hunting for info, your knowledge architecture’s busted. Check out document download rates, sharing frequencies, and content ratings to see what really packs a punch. The golden ticket? Knowledge reuse rates. When teams lean on existing solutions instead of reinventing the wheel, you’ve hit the jackpot.
Business Impact Measurement
The real story? Revenue impact. Companies with next-level knowledge management wrap up projects faster and dodge duplicate efforts. What about customer satisfaction scores? Track ’em alongside knowledge base usage. Support teams that ace internal knowledge-yep, more tickets resolved per day.
Keep tabs on employee retention in knowledge-heavy roles. A strong knowledge-sharing culture means less turnover in tech positions. And boosting new hire productivity? That’s a win. Onboarding with documented expertise gets newbies up to speed faster (a huge edge in talent tug-of-war).
Collaboration and Innovation Metrics
Cross-departmental collaboration takes off when knowledge flows like a river. Measure project success rates, innovation pipeline juiciness, and how quick you can counter competitors. These business metrics? They’re your proof if your BI bucks are making magic or just drumming up pretty reports.
Watch those knowledge contribution patterns. The high-flyers show a sweet balance in knowledge creation and consumption. If expertise is hoarded in one corner while others starve for info, your system’s kaput. Keep an eye on how sharp your expert identification is and knowledge transfer effectiveness during role changes or exits.
Final Thoughts
So, you’ve got business intelligence and knowledge management hooking up – quite the dynamic duo. What happens? Boom. Companies flip the script on how they capture, share, and leverage their expertise. The ones that embrace BI for knowledge systems? They see the needle move… faster decision-making, teamwork on steroids, and innovation? Through the roof. The data doesn’t lie – firms with robust knowledge-sharing cultures keep their talent like magnets and get newcomers up to speed in no time.
Now, brace yourself for the future… we’re talking AI-driven knowledge discovery, real-time collaboration analytics, and predictive smarts that sniff out knowledge gaps before they mess things up. Machine learning will do the heavy lifting – tagging content, serving up expertise like it’s on a silver platter just when teams are looking for it. These advances are making knowledge systems not just smart but straight-up intuitive.
But hold on… to really nail it, you need the right platform. Get those data pipelines flowing… and zero in on what truly counts. Skip the flashy dashboards (because it’s not about the bells and whistles). Look at user adoption and business impact. At LEAD.bot, we help firms tap into that hidden knowledge and build those human bridges that turn BI dreams into reality through our expertise mapping platform.